Monthly Archives: August 2012

OBIEE 11G – Starting Oracle Business Intelligence

About

How to start the system…

Oracle Business Intelligence runs within Oracle WebLogic Server, and therefore Oracle WebLogic Administration Server must be started before Oracle Business Intelligence components can be started and maintained.

To start the Oracle Business Intelligence system, you start:

  • the Administration Server
  • the Node Manager
  • the Managed Servers,
  • and then you start the system components.

Articles Related

Steps

Prerequisites

The following conditions must be met to start the Oracle Business Intelligence system:

  • The RPD file must be closed (if using the Administration Tool) so that it does not hold the read/write lock.
  • The repository database (which contains Scheduler schemas) that was specified during installation must be running, and a network connection to it must be available. Otherwise, error messages are displayed.

On Windows

With the Start BI Service Shortcut

Start the Start BI Service shortcut which start then the command:

MiddelwareHome\instances\instance1\bifoundation\OracleBIApplication\coreapplication\StartStopServices.cmd start_all.

It will prompt you for the WLS admin user. The letter case of the WebLogic admin user and password are important

This script start then:

  • the weblogic server and the managed server
  • the opmn BI Services.

Bringing up this service may take a few minutes depending on your environment, wait until the command line stops scrolling and indicates server in RUNNING mode. Keep this command window up to keep server up.

A standard output is:

Buildfile: StartStopServices.xml

get.credentials:
    [input] Please enter the username of a WebLogic admin user:
weblogic
Please enter the password for WebLogic user weblogic:

wls.admin.start:
     [echo] Starting WLS Admin Server at E:\MiddelwareHome\wlserver_10.3...

wls.alive:

wls.wait.alive:
     [echo] --> Weblogic Admin Server running: Admin console available at http:/
/WINDOWS11G:7001/console...

wls.mgd.start:
     [echo] Starting WLS Managed Server bi_server1 ...

wls.mgd.alive:

wls.mgd.wait.alive:
     [echo] --> WLS Managed Server is running: available at WINDOWS11G:9704...

opmn.start:
     [echo] Waiting for OPMN managed services to start...
     [echo] OPMN has been started.

show_url:
     [echo] Oracle BI should now be available at http://WINDOWS11G:9704/analytics

At the end of the process, a browser must launch with the analytic url: http://host:port/analytics

With the windows services

See this article on how to install the windows services: OBIEE 11G – BI Services as Windows Services Installation

Manually

Using the Oracle BI Systems Management API

You can use the Oracle BI Systems Management API start and stop Oracle Business Intelligence using:

See Starting and Stopping Oracle Business Intelligence Using the Oracle BI Systems Management API for examples

Extra

Changing Admin Server or Managed Server Port Numbers on Windows Operating Systems

If you change the Admin Server or Managed Server port numbers after you finish installing Oracle Business Intelligence on a Windows operating system, you must also update their values in the StartStopServices.cmd file.

To change port number settings in StartStopServices.cmd file after making post installation Admin Server or Managed Server port number changes on Windows operating systems:

  • Open the StartStopServices.cmd file for editing, from the following directory:
INSTANCE\bifoundation\OracleBIApplication\coreapplication
  • Update the port values for the Admin Server and Managed Server as required, for example:
set wls.admin.port=7002
set wls.mgd.port=9705

Support

Error 500–Internal Server Error

Error 500--Internal Server Error
From RFC 2068 Hypertext Transfer Protocol -- HTTP/1.1:
10.5.1 500 Internal Server Error
The server encountered an unexpected condition which prevented it from fulfilling the request.

This error can occur because the server are not immediately up and full running in memory when you start the script.

  • Verify that the two windows command contains that the servers (AdminServer and Managed Server) are in running mode
<19-feb-2011 4:19:17 uur PST>
  • If this is the case, wait a little bit and refresh your browser
  • If this is not the case, verify that you’re database is up and restart the BI system component services are up in EM.

Using a Presentation Variable in a Static Text View

Using a Presentation Variable in a Static Text View

Create an analysis that uses the VarSalesRep presentation variable in a Static Text view and in a Filter.
A Static Text view adds static text in the results.

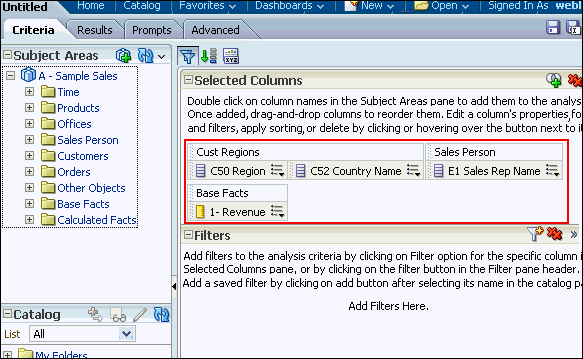
1. Create an analysis by selecting the following columns:

  • Customers > Cust Regions > C50 Region
  • Customers > Cust Regions > C52 Country Name
  • Sales Person > E1 Sales Rep Name
  • Base Facts > 1 Revenue

Screenshot for Step

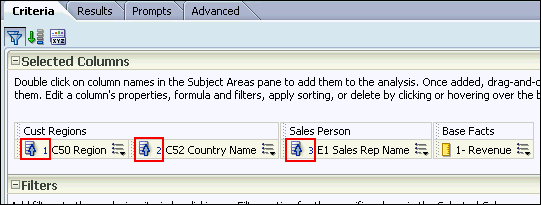
2 . Add ascending column sorts in this sequence: C50 Region, C52 Country Name, and E1 Sales Rep Nameas shown below:
Screenshot for Step
The Criteria tabbed page should look like this after adding the sorts:
Screenshot for Step
3 . Select the Results tabbed page.
Screenshot for Step
4 . Select New View > Other Views > Static Text.
Screenshot for Step
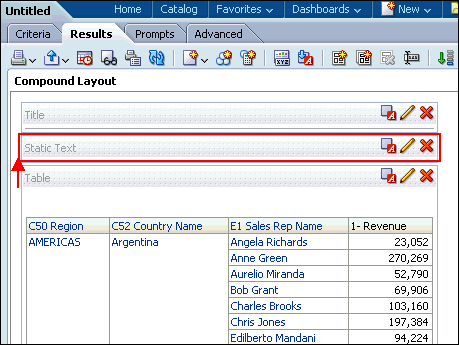
5 . Move the Static Text view above the Table view.
Screenshot for Step
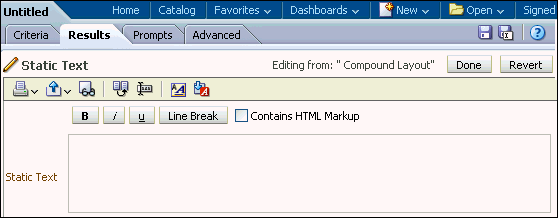
Click the Edit View icon on the Static Text view. The Static Text editor appears.
Screenshot for Step
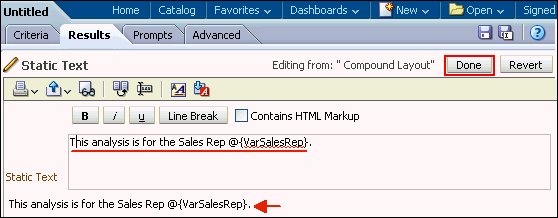
6 . In the Static Text editor, reference the VarSalesRep variable. Enter the following syntax in the Static Text pane: This analysis is for the Sales Rep @{VarSalesRep}.
The syntax for referencing a Presentation variable is as follows:

@{variables.variablename}[format]{defaultvalue} or @{scope.variables[‘variablename’]}

Where:
variablename is the name of the presentation or request variable

format (optional) is a format mask dependent upon the data type of the variable, for example #, ##0, MM/DD/YY hh:mm:ss. (Note that the format is not applied to the default value.)

default value (optional) is a constant or variable reference, indicating a value to be used if the variable referenced by variablename is not populated
scope identifies the qualifiers for the variable. You need to specify the scope when a variable is used at multiple levels (analyses, dashboard pages, and dashboards) and you want to access a specific value. (If you do not specify the scope, then the order of precedence is analyses, dashboard pages, and dashboards.
Examples:
@{variables.MyFavoriteRegion}{EASTERN REGION}
or

@{dashboard.variables[‘MyFavoriteRegion’]}

Screenshot for Step
Observe that your entry is previewed below the Static Text text box. Click Done.

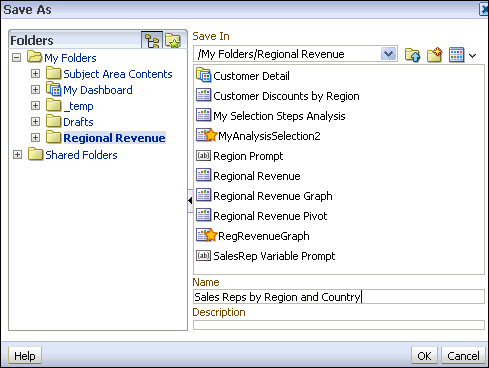
7 . Save your analysis as Sales Reps by Region and Country.
Screenshot for Step
Screenshot for Step
Your analysis should look like this:
Screenshot for Step
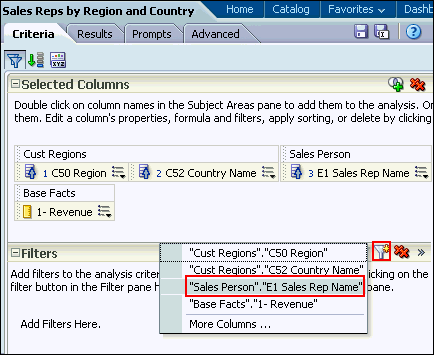
8 . a. Select the Criteria tabbed page.
b. In the Filters pane, click the Create a Filter icon and select “Sales Person “.”E1 Sales Rep Name “.
Screenshot for Step
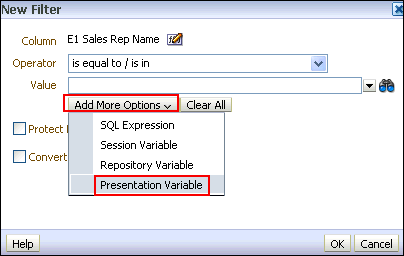
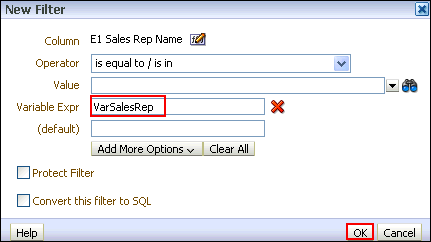
9 . a. In the New Filter dialog box, click Add More Options and select Presentation Variable.
Screenshot for Step
b. In the Variable Expr field, enter the variable name, VarSalesRep. Notice that you can also specify a default for the variable, but in this case the default is driven by the variable prompt, which is set to default to “Angela Richards”.
Screenshot for Step
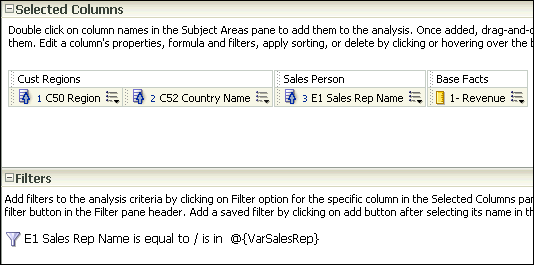
c. Click OK. The filter should look like this:
Screenshot for Step
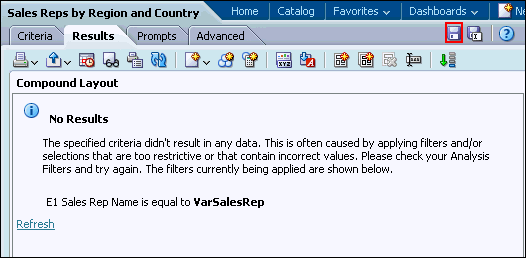
10 . Select the Results tabbed page. Because the variable dashboard prompt has not been run, the VarSalesRep presentation variable has not been populated with a value. Because of this, no results from the analysis meet the filter requirement.
Screenshot for Step
Save the analysis.
11 . Add the analysis Sales Reps by Region and Country and the newly created variable prompt to the Customer Detail dashboard.
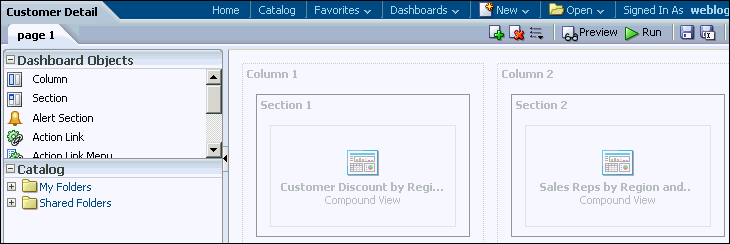
12 . Open the dashboard Customer Detail from the Regional Revenue folder, then click Page Options > Edit Dashboard.
Screenshot for Step
13 . Add a new column next to Column 1, and then navigate to the Sales Reps by Region and Country analysis and drag it to the new column.
Screenshot for Step
14 . Navigate to SalesRep Variable Prompt in the catalog pane, and drag the prompt above the Sales Reps by Region and Country analysis. Save the dashboard and run it.
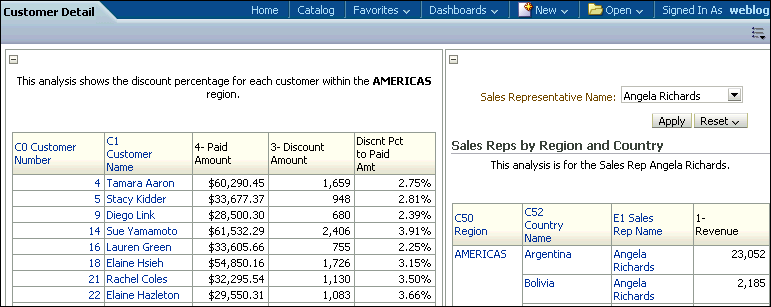
The Dashboard view looks like this:
Screenshot for Step
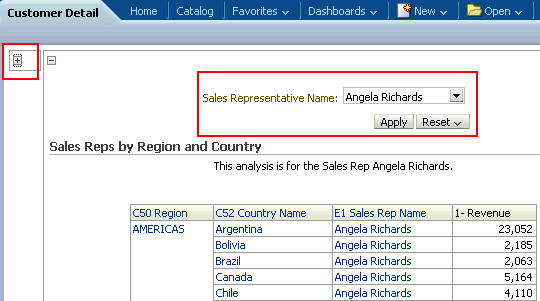
15 . Click the Collapse icon for the first column to minimize it.
Screenshot for Step
The dashboard runs and the variable dashboard prompt is preset to the default value, Angela Richards, which in turn appears in the Static Text view as expected and is used to filter the embedded analysis results. The value of a presentation variable is populated by the variable prompt. That is, each time you select a value in the variable prompt, the value of the presentation variable is set to that value.
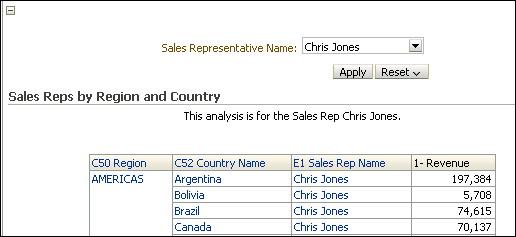
Click the drop-down list for the dashboard prompt, and select Chris Jones.
Screenshot for Step
Click Apply. The dashboard displays the presentation variable as Chris Jones.
Screenshot for Step
This concludes the topic of Presentation Variables and Filters.

Presentation variable OBIEE 11g

A presentation variable can be created as part of the process for creating a column prompt or a variable prompt. When the presentation varaible is part of a column prompt, it is associated with a specific column and takes on that column’s value. It is part of a variable prompt, you define the values that the prompt can have as it is not associated with any specific column. The name and value of the presentation variable is determined by the user when it is initially declared or when it is referenced in the analysis, dashboard, or agent.

There are three type of prompt i.e.

  • Column prompt
  • Variable prompt
  • Image prompt

Today here will discuss about the Variable Prompt.

1 . Create a new variable dashboard prompt that creates a Sales Representative presentation variable.
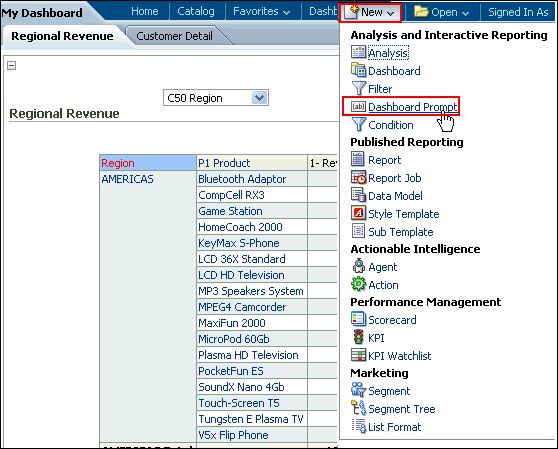
a. Click New > Dashboard Prompt and select Sample Sales as the subject area.
Screenshot for Step
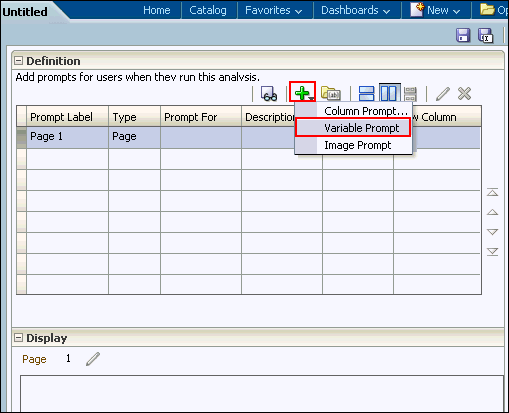
2 . Click New > Variable Prompt.
Screenshot for Step
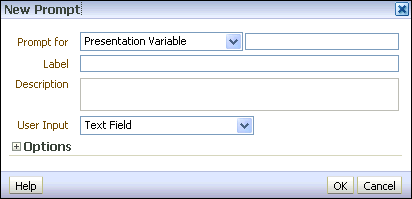
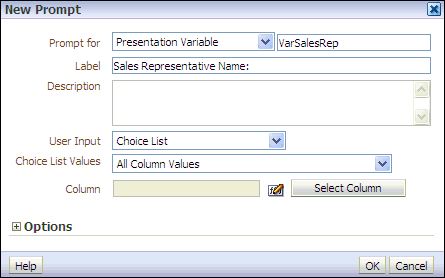
The New Prompt dialog box appears.
Screenshot for Step
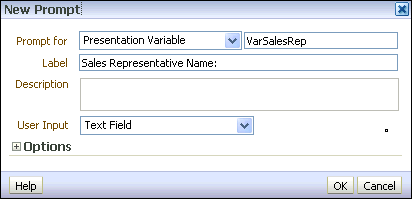
3 . a. Accept Presentation Variable as the default prompt type.
b. In the text box to the right of the drop-down list for the prompt type, enter the same variable that you entered in the Static Text editor,VarSalesRep.
c. Enter Sales Representative Name: in the Label text box.
Screenshot for Step
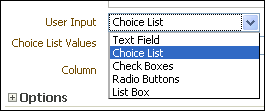
d. Select Choice List for User Input.
Screenshot for Step
e. Select All Column Values for Choice List Values.
Screenshot for Step
The dialog box should look like this:
Screenshot for Step
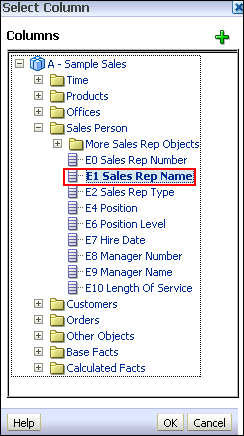
4 . a. Click Select Column and, in the Select Column dialog box, select Sales Person > E1 Sales Rep Name.
Screenshot for Step
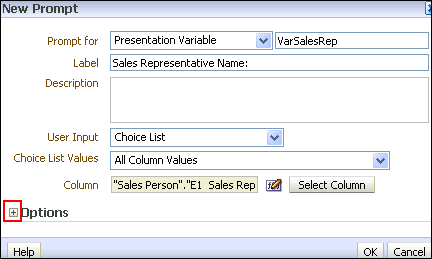
b. Click OK. The dialog box should look like this:
Screenshot for Step
Expand the Options section.
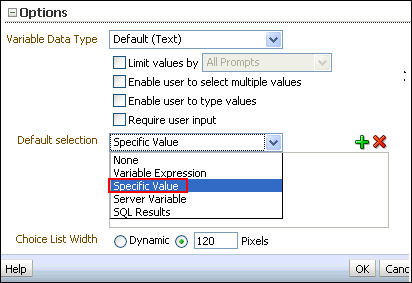
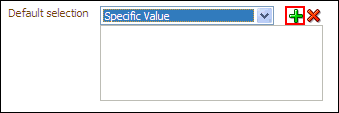
5 . Select Specific Value from the “Default selection” drop-down list.
Screenshot for Step
Click the Select Values icon.
Screenshot for Step
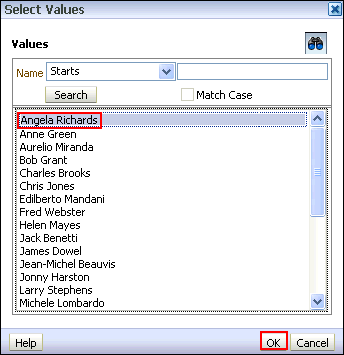
6 . In the Select Values dialog box, select Angela Richards and then, click OK.
Screenshot for Step
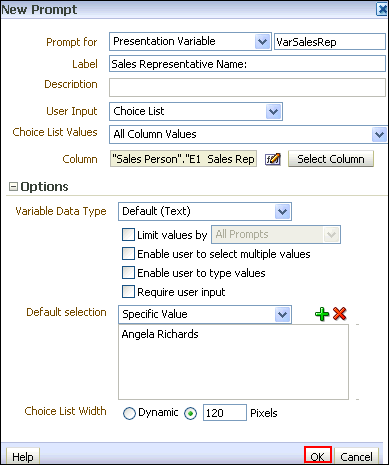
7 . The New Prompt dialog box should look like this:
Screenshot for Step
Click OK. The newly created variable prompt is displayed in the prompts definition list.
Screenshot for Step
8 . Save the prompt as SalesRep Variable Prompt in your Regional Revenue folder.
Screenshot for Step
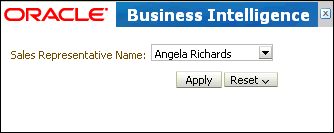
9 . Click the Preview icon (Screenshot for Step) to preview the prompt.
Screenshot for Step

Data Modelling – Key

FOREIGN KEY:

Foreign key is a referential constraint between two tables, A foreign key (FK) is a column or combination of columns that is used to establish and enforce a link between the data in two tables. You can create a foreign key by defining a FOREIGN KEY constraint when you create or modify a table.

In a foreign key reference, a link is created between two tables when the column or columns in another table reference the column or columns that hold the primary key value for one table. This column becomes a foreign key in the second table.

For example, the Sales.SalesOrderHeader table in the AdventureWorks2008R2 database has a link to the Sales.SalesPerson table because there is a logical relationship between sales orders and salespeople. The SalesPersonID column in theSalesOrderHeader table matches the primary key column of the SalesPerson table. The SalesPersonID column in theSalesOrderHeader table is the foreign key to the SalesPerson table.

Surrogate

It is a substitute primary key – for when you don’t have a real one. An ID column populated via a sequence is known as a surrogate key.

The use of SKs in Datawarehouse environments is not only simplicity of star design or performance.

You often need to populate your dimensions with extra records not found in the source table, such as “UNKNOWN” or “NOT APPLIES” records. If you don’t use SKs, What PK value would you use for this extra records?

How can you be sure that the values you choose won’t collide with future records from the source table?

Also, taking your dimensional schemas away from possible source key changes is a good idea. Of course creating and maintaining SKs adds complexity and is extra work for ETL processes.

Natural

If the table has a true primary key – it is known as a “natural key”

Business

Unique key that use the business users to identify uniquely an entity. The business key is a meaningful/business code based generally on the concatenation of attributes value of an entity instance.

Facts & Dimensions

Facts & Dimensions form the heart of a data warehouse. Facts are the metrics that business users would use for making business decisions. Generally, facts are mere numbers. The facts cannot be used without their dimensions.

Dimension data is denormalized where as fact table contains normalized data
Dimension table contains many columns where as fact table contains less columns only 2 in fact
The data in the dimension tables are less compared to the data in the fact tables
The data in the dimension table is static and descriptive in nature where as the fact table contains numeric and will change regularly
Dimension tables generally called as lookup or reference table as well. facts tables are the key performance indicators of the business

Dimension Table features  Fact Table features 
1. It provides the context /descriptive information for a fact table measurements. 1. It provides measurement of an enterprise.
2. Provides entry points to data.  2. Measurement is the amount determined by observation.
3. Structure of Dimension – Surrogate key , one or more other fields that compose the natural key (nk) and set of Attributes. 3. Structure of Fact Table – foreign key (fk), Degenerated Dimension and Measurements.
4. Size of Dimension Table is smaller than Fact Table. 4. Size of Fact Table is larger than Dimension Table.
5. In a schema more number of dimensions are presented than Fact Table. 5. In a schema less number of Fact Tables observed compared to Dimension Tables.
6. Surrogate Key is used to prevent the primary key (pk) violation(store historical data). 6. Compose of Degenerate Dimension fields act as Primary Key.
7. Values of fields are in numeric and text representation. 7. Values of the fields always in numeric or integer form.

OBIEE – History

Introduction

OBIEE comes from Siebel Analytics who comes from an earlier acquisition of nQuire by Siebel in 2002. You know now why a lot of file begin with this two letters “Nq”.

The product, which the San Mateo, Calif., company introduced at its Siebel User Week show here last week, is an extension of the Siebel Customer Analytic Applications and incorporates technology Siebel acquired from nQuire Inc. in late 2001.

Siebel Enterprise Analytic Platform 7.7 includes Siebel Analytics Server for calculation and integration, logical business model and metadata management, and caching. Other components include the Intelligent Interaction Management module for data mining; Interactive Dashboard, which provides a portal interface to the data; Siebel Answers for ad hoc querying; and Siebel Delivers for sending alerts of changes in data.

Siebels new analytics platform will face entrenched vendors such as Cognos Inc., Business Objects S.A. and MicroStrategy Inc.

– Rakesh Patil

OBIEE 11g installation

NOTE: OBIEE 11g (11.1.1.3) BI Administration Tool does not work under Windows 64-bit OS. It is expected that the next release of OBIEE 11g (11.1.1.4) will support 64-bit Operating Systems for the OBI Client applications. But Presentation Services work with the present release. So, think twice before you take decision to install 11g(11.1.1.3) on 64-bit OS.
So, if you have decided to install on 64-bit machine…follow these steps:

This installation post is going to be series of 3 parts. This is the first of the 3 posts.

Part-1 –> Download software and configuring RCU (Repository Creation Utility)
Part-2–> Installing OBIEE 11g
Part-3–> Configuration

Part-1:
Download OBIEE 11g(11.1.1.3.0) software and RCU(for 32 bits)from here. As there is no RCU for 64bits, download the 32bits one and it works)

also download RCU

Once you download all the files, extract them and keep them under one directory(Keeping RCU in the same directory is not mandatory, just for convinience).


Before starting the installation keep your have got database up and running. RCU will create two schemas in the installation process…

First step of installaton is running RCU (Repository Creation Utility), go to C:\Software\OBIEE11gR1\bishiphome\rcuHome\BIN and double click on rcu.bat file.

Welcome page of the installation wizard will open …click Next. Select Create

Click Next

Enter all the required information, be sure that the database user has got sysdba previlages…Click Next

Click OK

Enter the Prefix (or leave the default one DEV) and select the components install…

Click OK and enter the passwords for all the users (2 users) that created in the following screen…

Click Next

Click OK

Click OK

Click Create

Click Close..we are done with RCU

Once the RCU install : Go to OBIEE11g

OBIEE11g (11.1.1.6) Installation Steps

Download all the OBIEE11g 64 bit files from Oracle site and unzip all the files and click on “setup.exe” on disk 1 to start the installation process.

Click on next

Click on Skip software updates and click next

Click on simple install and click next

Click next

Create a OBIEE11g home directory and ensure there are no spaces on the folder name. Locate the folder and click next.

Provide the Administration user name and password.

Click next

Provide the connect string and metadata schema name (DEV_BIPLATFORM)

Click next

Uncheck the security update and click next.

Click on Install

Once the configuration is 100% complete, click on next.

Once the installation is complete click finish. The system will open up the analytics page.

Login with the weblogic user ID and Password and check the sample reports.